Deploy Wazuh everywhere, your SIEM finally sees your network
Enroll Wazuh agents on your Linux servers, Macs, and Windows workstations, with log upload via Tailnet, never through the open internet.
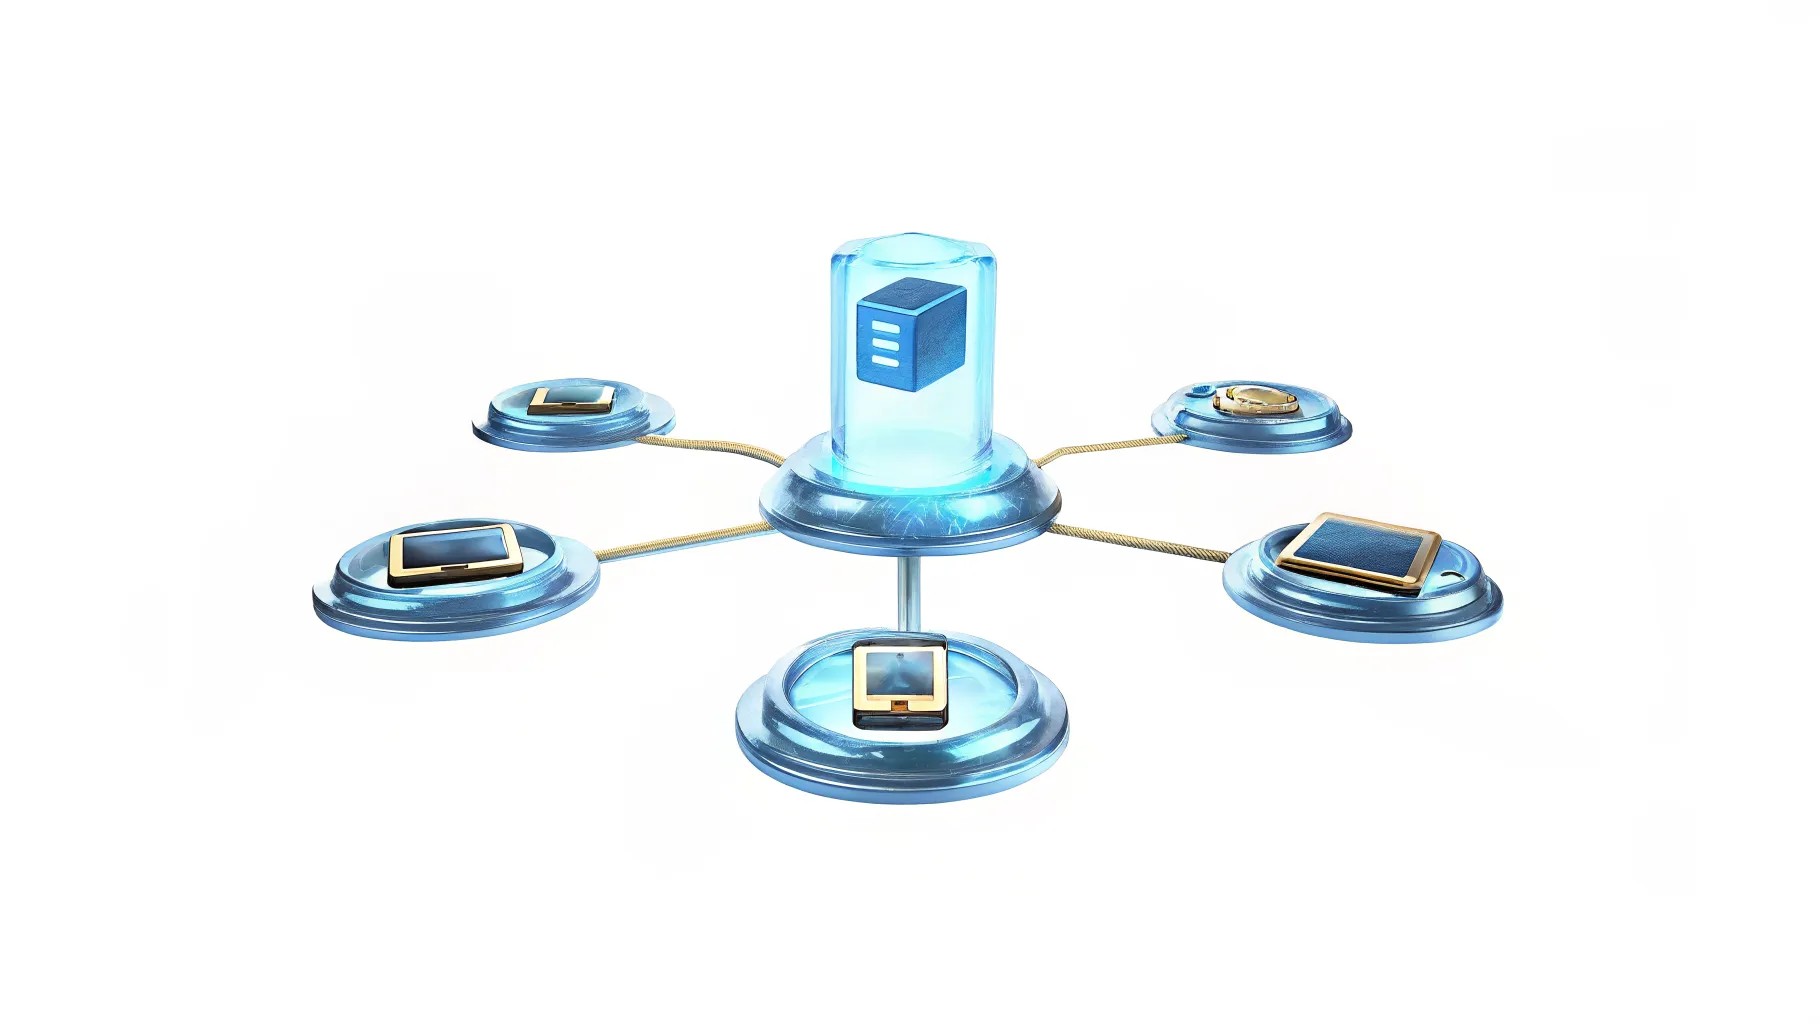
Series · episode 3 of 7Build Your Sovereign SIEM Contents
- Prologue Build your sovereign SIEM for SMEs, compliant with GDPR/NIS2 without CLOUD Act
- 1 Your sovereign SIEM's foundation, a hardened VPS outside the CLOUD Act
- 2 Wazuh all-in-one, your homegrown Splunk for the price of a VPS
- 3 Deploy Wazuh everywhere, your SIEM finally sees your networkyou are here
- 4 CrowdSec up front, blocking before they hit you
- 5 Rspamd in front of your inbox, phishing stops at the doormat
- 6 Santa on your Macs, the uninvited binary stays at the door
- 7 Alerting and total cost, the final tally of your sovereign SIEM
UPDATE, August 2026. The stable branch moved to Wazuh 4.14.7 on July 29th. The commands below still name the 4.14.5 agent, replace the number with 4.14.7 or grab the latest .pkg/.msi from the Wazuh packages page.
In the previous episode, you set up a security console that runs Wazuh on your hardened VPS, acting as a manager, indexer, and dashboard on a single node, with the dashboard locked to Tailnet-only. A fine machine, but for now, it only sees itself.
That’s useful, your server monitors itself, validates your hardening, and reports its own CVEs. But a SIEM that only looks at the server it’s running on is like a camera pointed at its own box. Today, we’re turning it towards the rest of the room.
We’re going to deploy Wazuh agents on your fleet. Your Linux servers, Macs, and Windows machines. Each machine gets a sensor that collects its logs, security events, and file integrity, and sends it all back to the manager. Your SIEM goes from nearsighted to panoramic.
One non-negotiable rule, set from episode 1 and commanding this whole chapter. This communication goes through the Tailnet, never through the open internet. The manager only listens on your private mesh. An agent not in your Tailnet talks to nothing.
This stack, I use daily. The commands that follow are the ones you’ll type yourself, in order, on your manager, then on each machine to monitor.
Before you start
Three things to keep in mind before the first command.
What you need. The Wazuh manager from episode 2, operational. Administrator access on each machine to enroll. And most importantly, each machine to monitor must be a member of your Tailnet, just like your manager. You’ll run tailscale up on each endpoint. Without it, nothing comes back.
What changes. At the end, your dashboard won’t list a single agent, but as many as you have machines. Each one reports its logs, audit configuration, vulnerabilities, and file integrity, all in one place, under your single eye.
What doesn’t change. An agent observes, it doesn’t block anything. It tells you when an application starts, when a file changes, when a connection fails. Deciding which applications have the right to launch on your Macs, that comes later, with another tool, in another episode. Here, we’re just looking. We’re not blocking anything yet.
Opening the right doors, and only those
Before touching any endpoints, a gesture on the manager. Until now, your server hasn’t been listening to the outside world on anything, and the dashboard has been folded onto the Tailnet. Remote agents need to reach the manager on two ports.
- Port 1515, for enrollment. That’s the initial handshake, encrypted, where a new agent introduces itself and receives its authentication key.
- Port 1514, for reporting logs and events, once the agent is enrolled.
And that’s where your sovereignty comes into play. Those two ports, you open only on the Tailscale interface, never globally.
sudo ufw allow in on tailscale0 to any port 1514 proto tcp
sudo ufw allow in on tailscale0 to any port 1515 proto tcp
You recognize the gesture, it’s the same one as SSH in episode 1, the same one as the dashboard in episode 2. You allow on tailscale0, your encrypted mesh, and nowhere else. The trap would be to type sudo ufw allow 1514/tcp all on its own. That command opens your SIEM to the world’s scanners. Ours keeps it invisible.
Check your firewall status.
sudo ufw statusYou should see your two new rules, both marked on tailscale0. If there’s a global 1514/tcp hanging around, get rid of it without hesitation, that’s a breach.
Last thing to note, the Tailscale address of your manager, the one every agent will target.
tailscale ip -4That’s the address you’ll pass to the agents. Not the VPS’s public IP, it doesn’t listen on these ports anyway. In everything that follows, I’ll note it as <IP_TAILSCALE_OF_THE_MANAGER>.
Step 1, enrolling a Linux server
We start with the simplest one, an Ubuntu or Debian server. Three steps, add the Wazuh repository, install the agent and give it the manager’s address, start it up.
First, the official repository.
sudo apt-get install gnupg apt-transport-https
curl -s https://packages.wazuh.com/key/GPG-KEY-WAZUH | sudo gpg --no-default-keyring --keyring gnupg-ring:/usr/share/keyrings/wazuh.gpg --import && sudo chmod 644 /usr/share/keyrings/wazuh.gpg
echo "deb [signed-by=/usr/share/keyrings/wazuh.gpg] https://packages.wazuh.com/4.x/apt/ stable main" | sudo tee -a /etc/apt/sources.list.d/wazuh.list
sudo apt-get update
Nothing exotic. You import the signature key for the repository, declare the Wazuh repository, refresh the package list. Standard APT routine.
Then, the installation, with the trick that does all the work. Prefixing the installation command with the WAZUH_MANAGER variable tells the package which manager to enroll with during installation.
sudo WAZUH_MANAGER="<IP_TAILSCALE_OF_THE_MANAGER>" WAZUH_AGENT_GROUP="linux" apt-get install wazuh-agentThe WAZUH_AGENT_GROUP="linux" puts this machine in a group named linux. You’ll see what groups are for later, just remember to assign them now.
Finally, start the service and enable it on boot.
sudo systemctl daemon-reload
sudo systemctl enable wazuh-agent
sudo systemctl start wazuh-agent
And there you go, your Linux server is reporting. If you’re running on RHEL, Alma, or Rocky, the principle is the same, just replace the APT repository with the YUM one and apt-get install with dnf install. The WAZUH_MANAGER variable works the same way.
Step 2, enrolling a Mac
Macs get interesting because macOS has its own rules. Let’s start with the deployment, the twist comes right after.
The Mac agent comes as a .pkg package, and there are two versions, one for Apple Silicon and one for old Intel Macs. On a recent fleet, it’s Apple Silicon.
curl -O https://packages.wazuh.com/4.x/macos/wazuh-agent-4.14.5-1.arm64.pkg
echo "WAZUH_MANAGER='<IP_TAILSCALE_OF_THE_MANAGER>' && WAZUH_AGENT_GROUP='macos'" > /tmp/wazuh_envs
sudo installer -pkg wazuh-agent-4.14.5-1.arm64.pkg -target /
The mechanism changes a bit in form but not in substance. On macOS, deployment variables don’t go in front of the command, they’re written to a temporary file, /tmp/wazuh_envs, that the installer reads on the fly. The result is the same, the agent knows its manager and its group. For an Intel Mac, replace arm64 with intel64 in both lines that mention it.
Then, start the agent.
sudo launchctl bootstrap system /Library/LaunchDaemons/com.wazuh.agent.plistOn macOS, the agent lives under /Library/Ossec/, and its control binary is /Library/Ossec/bin/wazuh-control, with the start, stop, and status verbs if you want to pilot it by hand.
The macOS landmine, TCC and full disk access
Now, the truth that most tutorials gloss over. On macOS, your agent will start, enroll, appear active in the dashboard, and yet remain half-blind.
The reason is TCC, for Transparency, Consent and Control, Apple’s permission system by usage. It filters access to sensitive folders, and it doesn’t cut any corners. The agent isn’t an application in Apple’s sense, it’s a package of binaries. Without explicit permission, it’s refused access to the zones TCC protects. Its file integrity monitoring turns on, but it can’t read what it can’t see.
The workaround is to grant the agent full disk access. On a managed fleet, that’s done properly with MDM, a configuration profile pushed by Jamf or equivalent, that declares the permission once and for all on all machines. On a single machine, you do it by hand in the privacy settings. That’s an extra step on top of Linux, and it’s specific to Apple, so keep that in mind before you’re surprised that the Mac reports less than the server.
Step 3, enrolling a Windows machine
Windows, last one in. The agent installs via an MSI package, in silent mode, from a PowerShell console opened as an administrator.
msiexec.exe /i.\wazuh-agent-4.14.5-1.msi /q WAZUH_MANAGER="<IP_TAILSCALE_OF_THE_MANAGER>" WAZUH_AGENT_NAME="accounting-post" WAZUH_AGENT_GROUP="windows"Same logic as everywhere, the manager, a readable name for the machine, and its group. The WAZUH_AGENT_NAME is handy on Windows, where you’ll soon have ten machines that look the same, so it’s nice to give them names.
Then, start the service.
Start-Service WazuhSvcIn CMD, that’s NET START WazuhSvc, take your pick. The agent installs under C:\Program Files (x86)\ossec-agent.
What Windows brings specifically is reading Windows event logs, the famous Security, System, and Application trio, where failed login attempts, privilege elevations, and account creations land. And the FIM can monitor the registry, malware’s favorite playground for surviving reboots. Your Windows machine is no longer a black box.
Step 4, verifying that everything’s reporting
Three machines enrolled, time to make sure they’re talking to the manager. Back on the Wazuh server, one command.
sudo /var/ossec/bin/agent_control -lIt lists all your agents with their ID, name, and status. Four possible statuses, and you need to know how to read them.
- Active, the agent is connected and reporting. That’s what you want to see everywhere.
- Pending, it just enrolled and is waiting for its first full handshake. That’s temporary, give it a minute.
- Disconnected, it was connected and isn’t anymore. The manager considers an agent lost if it hasn’t given a sign of life in fifteen minutes.
- Never connected, it enrolled but never managed to report. That’s the classic symptom of a closed port or a machine outside the Tailnet.
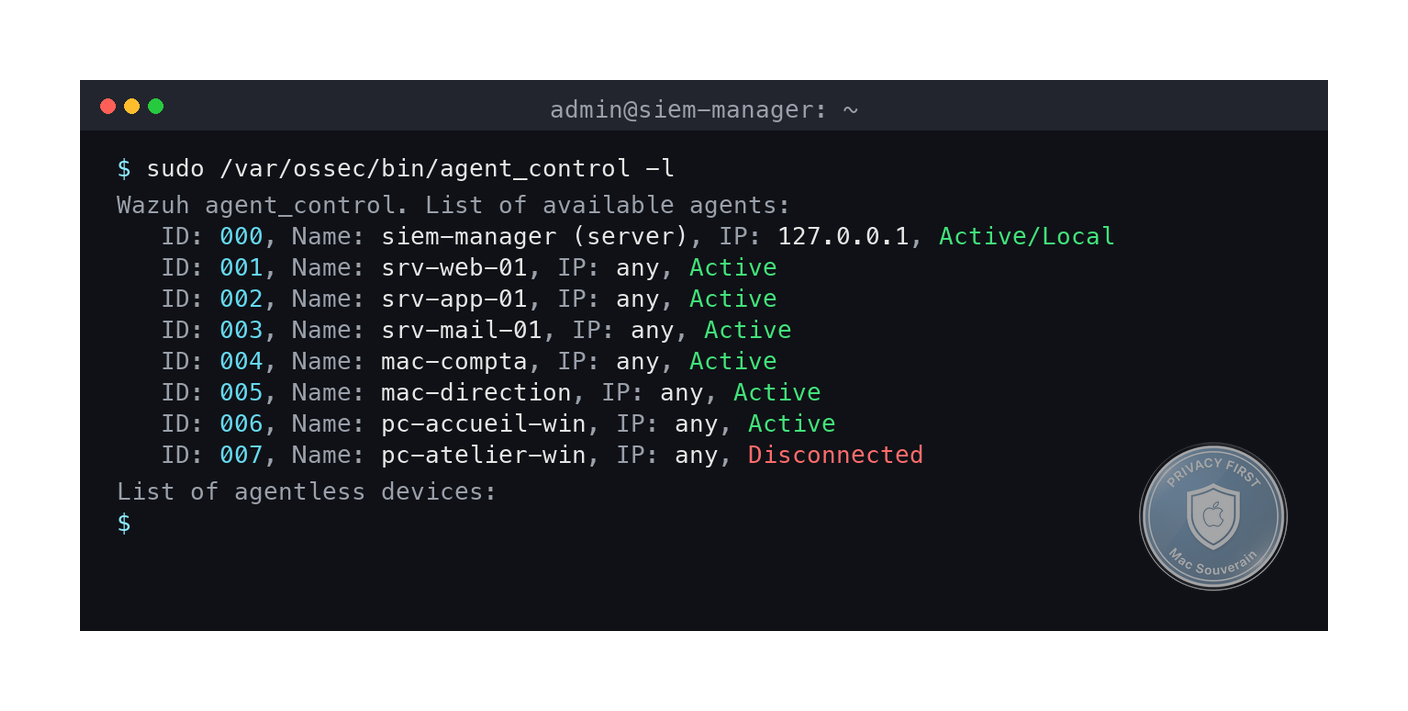
The same table exists on the dashboard, prettier to the eye. The Agents view shows the count of Active, Disconnected, Pending, Never connected, and the details of each machine, its modules, its last activity. That’s your control room, now populated.
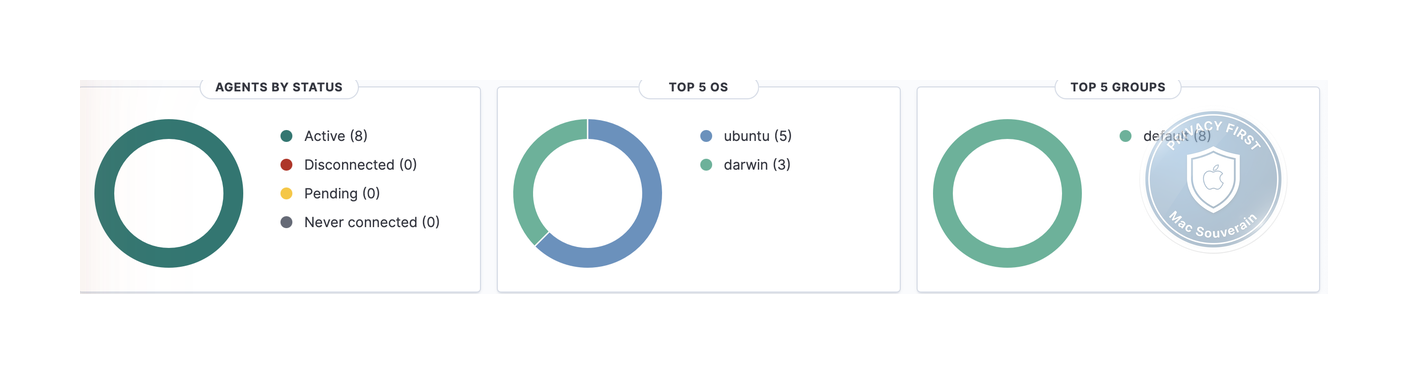
And there’s the shift. Each active machine runs, on itself, exactly the modules your server was running on itself in episode 2. The CIS configuration audit. Vulnerability detection on its packages. File integrity monitoring. Log analysis. Except now, it’s not one machine, it’s your fleet, and everything converges on one screen.
Going further, monitoring a specific folder
By default, the agent monitors sensitive system directories. But you’ve got a folder that matters more than the others, your client data, your accounting, a shared drive. You want to know, down to the second, if anyone touches it.
That’s the FIM’s job, File Integrity Monitoring. And instead of editing each machine by hand, you use groups that you assigned during enrollment. A group shares a configuration, pushed automatically by the manager to all its members. You write once, it applies everywhere.
On the manager, edit the shared configuration file for the relevant group, for example /var/ossec/etc/shared/linux/agent.conf, and declare the folder to monitor in the <syscheck> block.
<syscheck>
  <directories check_all="yes" realtime="yes">/srv/client-data</directories>
</syscheck>
Two attributes to understand. check_all="yes" records everything that characterizes a file, its cryptographic hashes, its size, its owner, its permissions, its dates. Any change is spotted. realtime="yes" asks for real-time monitoring, the alert comes at the moment of the change, without waiting for the next scan.
A note of honesty on that real-time. It’s only available on Linux and Windows. On macOS, the FIM falls back on scheduled scans, periodic. A modification between two passes is only seen on the next pass. That’s not a bug, it’s a macOS limitation, but keep that in mind before you count on an instant alert on the Mac side. Another detail that trips people up, the folder must exist before you restart the agent, or it’s ignored.
If it’s not working
Deploying agents is simple when everything goes right, and it always has the same handful of causes when it goes wrong. Here are the real ones, in the order you’ll encounter them.
Problem, the agent stays in ‘Never connected’
Probable cause, in nine cases out of ten in our case, a network path issue. Either the manager’s ports 1514 and 1515 aren’t open on tailscale0, or the machine isn’t in the Tailnet, or you gave the agent the VPS’s public IP instead of its Tailscale address.
Solution, check those three. On the manager, sudo ufw status should show your two new rules both marked on tailscale0. On the endpoint, tailscale status should confirm it’s in the mesh. And re-read the value of WAZUH_MANAGER, it should point to the manager’s Tailscale address, not its public IP.
Problem, the agent goes from ‘Active’ to ‘Disconnected’
Probable cause, it was reporting, it’s not anymore. The manager cuts off after fifteen minutes without news. Often, the agent service has stopped, or the Tailscale link has dropped.
Solution, check that the service is running. sudo systemctl status wazuh-agent on Linux, Start-Service WazuhSvc on Windows, /Library/Ossec/bin/wazuh-control status on macOS. And take a look at the agent’s log, always in the same place depending on the platform, /var/ossec/logs/ossec.log on Linux, /Library/Ossec/logs/ossec.log on Mac, the installation folder on Windows.
Problem, the Mac is ‘Active’ but isn’t reporting much
Probable cause, the infamous TCC. The agent is running, but without full disk access, it’s blind on the zones macOS protects.
Solution, grant the agent full disk access, by MDM on a managed fleet, by hand on a single machine in the privacy settings.
Problem, the agents are ‘Active’ but the dashboard stays empty
Probable cause, that’s not an agent problem. If the machines are reporting but nothing appears in the interface, the culprit is downstream, between the manager and the indexer. Remember episode 2, Filebeat pushes alerts to the indexer.
Solution, diagnose on the server side, not on the agent side. Check that Filebeat is talking to the indexer and that the indexer is digesting. Don’t waste an hour reinstalling agents that are working perfectly.
The first day is noisy, that’s normal
One last word of honesty, because I’d rather you hear it from me before you figure it out on your own. The day you plug in ten machines at once, your dashboard is going to explode.
Each machine arrives with its configuration audit reporting dozens of deviations from the CIS baseline. Each FIM reports legitimate files that change as they’re used. At first, the noise drowns out the signal, and that’s disorienting.
That’s not a bug. That’s the raw state of a SIEM you’ve just turned on in a real fleet. The work that follows, calibrating rules, filtering out false positives, adjusting thresholds so you’re only woken up when it matters, that’s human work, not magic software. We said it from the start of the series, the hard part isn’t the tech, it’s the tuning. That fine-tuning, that calibrated alerting, that’s episode 7’s payoff.
For now, enjoy. Your SIEM isn’t looking at its own belly anymore, it’s seeing your network.
For the impatient
What this article does. You deploy Wazuh agents on your fleet, your Linux servers, Macs, and Windows machines. Each machine reports its logs, configuration audit, vulnerabilities, and file integrity to the manager. Everything goes through the Tailnet, never through the open internet. You verify the enrollment, extend file monitoring via groups, and weather the first day’s noise.
Concretely, the commands.
- On the manager, open ports 1514 and 1515 on
tailscale0only:sudo ufw allow in on tailscale0 to any port 1514 proto tcp, then the same for1515. Never globally. - Prerequisite, every endpoint must be in the Tailnet (
tailscale up). - Linux: add the Wazuh repository, then
sudo WAZUH_MANAGER="<IP_TAILSCALE_OF_THE_MANAGER>" WAZUH_AGENT_GROUP="linux" apt-get install wazuh-agent, thensystemctl enable --now wazuh-agent. - macOS:
curl -Othe.pkgarm64, write the variables in/tmp/wazuh_envs,sudo installer -pkg... -target /,sudo launchctl bootstrap system /Library/LaunchDaemons/com.wazuh.agent.plist. Then grant the agent full disk access. - Windows:
msiexec.exe /i.\wazuh-agent-4.14.5-1.msi /q WAZUH_MANAGER="<IP_TAILSCALE_OF_THE_MANAGER>" WAZUH_AGENT_GROUP="windows", thenStart-Service WazuhSvc. - Verify from the manager:
sudo /var/ossec/bin/agent_control -l, aim for ‘Active’ everywhere. - Extend FIM via the group, in
/var/ossec/etc/shared/<group>/agent.conf,<syscheck>block withcheck_all="yes" realtime="yes"(real-time Linux and Windows only, not macOS).
In summary
You started with a SIEM that only saw itself, and you end with a SIEM that sees your fleet.
You opened the agent ports on the Tailnet only, 1514 and 1515 on tailscale0, never globally. You enrolled your three families of machines, Linux in three commands, Macs managing TCC, Windows in silent MSI. You verified the reporting with agent_control -l and in the dashboard, and you extended file monitoring on your sensitive folders via groups.
Each machine you plug in is free on the license side, it’s 100% open source, no limit on agents. Where the American SaaS charges by log volume, by the number of machines, the more you see, the more you pay. With you, seeing more costs nothing.
But you’re observing. You see attacks, you’re not blocking anything yet. In episode 4, you add the first active line of defense, CrowdSec, the community network that blocks known attackers before they even knock on your door. Your SIEM starts to bite.
Technical terms? Check the glossary.