Wazuh all-in-one, your homegrown Splunk for the price of a VPS
Install Wazuh (manager, indexer, dashboard) on a single node, harden passwords and dashboard in Tailnet-only, adjust JVM heap, initial dashboards without agents.

Series · episode 2 of 7Build Your Sovereign SIEM Contents
- Prologue Build your sovereign SIEM for SMEs, compliant with GDPR/NIS2 without CLOUD Act
- 1 Your sovereign SIEM's foundation, a hardened VPS outside the CLOUD Act
- 2 Wazuh all-in-one, your homegrown Splunk for the price of a VPSyou are here
- 3 Deploy Wazuh everywhere, your SIEM finally sees your network
- 4 CrowdSec up front, blocking before they hit you
- 5 Rspamd in front of your inbox, phishing stops at the doormat
- 6 Santa on your Macs, the uninvited binary stays at the door
- 7 Alerting and total cost, the final tally of your sovereign SIEM
UPDATE, August 2026. The stable branch moved to Wazuh 4.14.7 on July 29th, dropping the deprecated wazuh-dbd daemon, with updated Python dependencies and cluster sync fixes. The install command points to the 4.14 branch, so it serves you 4.14.7 directly, nothing to change.
In the previous episode, you set up an empty safe: a VPS on a Swiss host, hardened to the bone, SSH via key, firewall closed, administration behind Tailscale, encrypted backups off-site. A nice machine. But for now… it’s not watching anything!
Today, we’re filling it up. We’re installing Wazuh, the brain of the whole stack, on this single node. Manager, indexer, and dashboard, the three central components of a SIEM, on the same machine. It’s the all-in-one mode, and that’s exactly what a small business needs to start with.
The promise of the series is in one sentence, set at the opening. The functional equivalent of a Splunk, for the price of a VPS. By the end of this article, you’ll have a security console running, seeing your own machine already, and it won’t have cost you a single euro in licensing. Whereas the same perimeter with an American vendor would run from a few thousand to tens of thousands of dollars per year, depending on the size of your fleet, with your logs stored in a very unfavorable jurisdiction.
This stack, I use every day. The commands that follow are the ones you’ll type yourself, in order, on the server from episode 1.
Three components, one machine
Before installing, understand what you’re installing. A SIEM Wazuh isn’t a monolithic block, it’s three roles that pass the baton.
- The manager is the brain. It receives logs, runs the analysis engine, correlates events, applies rules, and raises alerts. It’s the one that decides that a sudden spike of failed login attempts at 3 AM deserves to wake you up.
- The indexer is the memory. It stores and indexes alerts so you can search, filter, and go back in time. It’s a fork of OpenSearch, the open-source search engine, which is itself a fork of Elasticsearch. Remember this detail, it’ll come back to bite us in the best possible way.
- The dashboard is the window. The web interface through which you read all this, accessible on port 443. It queries the manager for configuration and the indexer for data.
A fourth player works in the shadows, Filebeat, the pipe that pushes alerts from the manager to the indexer. You won’t touch it, but when something goes wrong, it’s often the first thing you look at.
In an enterprise, these three components live on separate machines to handle the volume and maintain high availability. For a small business with up to a hundred machines being watched, it’s overkill. The all-in-one mode puts all three on the same server, and that’s more than enough to start with. The official documentation even sizes this mode for 1 to 100 agents.
We’ll come back to the moment when all-in-one isn’t enough later on. But for now, one machine, and let’s go.
Installation in one command
Wazuh offers two paths. The first, step-by-step, installs the indexer, then the manager, then the dashboard separately, editing the configuration files by hand. It’s educational, it’s long, and you don’t need it for a single node. The second is the official assistant, which does everything at once.
We’re taking the assistant.
curl -sO https://packages.wazuh.com/4.14/wazuh-install.sh && sudo bash./wazuh-install.sh -aLet’s break it down. The curl -sO downloads the installation script from the official Wazuh repository, branch 4.14. The sudo bash./wazuh-install.sh -a runs it with admin rights, and the -a flag means all-in-one, all on one machine. This flag tells the assistant to install and configure the three components on this same machine, generate TLS certificates for secure communication between them, and create passwords.
At the end, the assistant displays the admin password in the console. Note it down, it’s your first key to the kingdom. If you missed it while scrolling through the terminal, you can retrieve it properly with:
sudo tar -O -xvf wazuh-install-files.tar wazuh-install-files/wazuh-passwords.txtThis command extracts, without decompressing onto the disk, the file that lists all the passwords generated during installation. We’ll deal with these passwords in a moment, because passwords generated by a script are just a starting point, not a final destination.
At the time of writing, the stable version is 4.14.5, released on April 23, 2026. The installation URL points to 4.14/, so you’re still getting the latest version of that branch. If a 4.15 has been released when you’re reading this, check the current branch on the release notes page before running the command.
The memory trap, where 90% of installs fail
If there’s one thing you should remember from this episode, it’s this. The number one cause of Wazuh installs that struggle, crash, or die after a few days is poorly configured memory on the indexer.
Remember, the indexer is a fork of OpenSearch, which runs on the JVM, the Java virtual machine. And the JVM reserves a fixed zone of memory for itself at startup, called the heap (or the “heap space”). Too small, the indexer suffocates under the data. Too big, it takes up all the RAM and starves the manager, dashboard, and OS running alongside it on the same machine. That’s the whole point of the single-node setup, three big memory hogs sharing one envelope.
The official rule is clear and simple. The heap is half of the machine’s RAM. And both the minimum and maximum boundaries should be the same.
Why the same? Because if you let the JVM resize its heap on the fly, it spends all its time reallocating memory instead of indexing your logs. By fixing the floor and ceiling at the same value, you’re telling it “here’s your sandbox, not a byte more or less, now get to work”.
You set this in a file, /etc/wazuh-indexer/jvm.options.
sudo nano /etc/wazuh-indexer/jvm.optionsFind the two lines -Xms (the lower bound) and -Xmx (the upper bound), and set them to half of your RAM. That’s why episode 1 had you aim for 12 GB of RAM, not 8. On a 12 GB machine, the heap takes up 6 GB, leaving 6 GB for everything else, the manager, dashboard, Filebeat, and the system. Plenty of room to breathe.
-Xms6g
-Xmx6g
Then restart the indexer to apply the new value.
sudo systemctl restart wazuh-indexerIf you started with 8 GB to test, your heap value is -Xms4g / -Xmx4g, and you’re living on the edge with 4 GB left for everything else. It’s tight, but it works.
One last detail for the curious. The “half of RAM” rule also has an absolute ceiling, around 32 GB of heap. Don’t worry about this for now, it’s a good general OpenSearch practice, not a Wazuh-specific limit, and at the scale of a small business, you’re nowhere near it. I’m just mentioning it so you’re not surprised if you run into it later while scaling up a bigger infrastructure.
While we’re on the topic of memory, a related rule. The JVM should never swap. If the system starts using the disk as additional memory for the indexer, performance tanks. On a properly sized VPS, with the heap set to half of RAM, you shouldn’t be swapping. But it’s the first thing to check when things start to slow down.
Locking down the house
The installation gives you a functional console. It also gives you passwords generated by a script and a dashboard that, by default, wants to be accessible. Two things to take back under your control before you take your seat.
Change all the default passwords
The passwords generated during installation aren’t bad in and of themselves, but they’re sitting in a file on the server, and you didn’t create them. Good hygiene dictates that you regenerate everything with your own secrets. Wazuh comes with a tool for this, deposited by the assistant in the indexer.
sudo bash /usr/share/wazuh-indexer/plugins/opensearch-security/tools/wazuh-passwords-tool.sh -a -A -au wazuh -ap <CURRENT_PASSWORD>The -a flag targets all users, -A applies the change, and the -au / -ap pair provides the current admin user and password. In all-in-one mode, the tool automatically propagates the new passwords to the relevant components. You don’t have to recopy them one by one.
Your new passwords should meet a minimum complexity, 8 to 64 characters, with at least one uppercase letter, one lowercase letter, one number, and one symbol from .*+?-. Generate them with your password manager, don’t make them up on the spot.
Certificates, already there
Good news, you don’t have to do anything on the internal encryption front. The -a flag on the assistant generated a little certificate authority and deposited the certificates under /etc/wazuh-indexer/certs/ and so on. The three components are already talking to each other securely. It’s done, it’s clean, don’t touch it.
The only visible effect is that when you first access the dashboard, your browser will show a security warning because the certificate is self-signed and not recognized by a public authority. That’s normal, and for a dashboard that won’t be exposed to the public, it’s perfectly acceptable. Click through the warning, and you’re in.
A quick note to anticipate the temptation. You might want a “real” certificate, via Let’s Encrypt. Don’t do it here. Let’s Encrypt validates your certificate by verifying that your server responds on the internet, which means you have to open a port to the world. That’s the exact opposite of what we’ve been building since episode 1.
If the self-signed certificate really bugs you, Tailscale can emit a proper certificate for your node without any public exposure. But honestly, for a console that only you’ll be consulting, the self-signed certificate is good enough. We’re not going to punch a hole in the wall we just built to make a browser warning go away.
The dashboard, invisible from the internet
This is the most important security gesture of the episode, and it’s the one that separates a sovereign SIEM from one sitting on the curb. By default, nothing guarantees that your dashboard will stay private. The port 443 serving the interface should never be accessible from the internet.
Your security dashboards, they’re maps of your weaknesses, exactly what an attacker dreams of seeing.
The series’ rule, set in episode 1, is inflexible. No public services. The dashboard lives behind Tailscale, accessible only to you, just like SSH did before it.
Two locks, working together. First, we ask the dashboard to only listen on the Tailscale IP of the server, not on all interfaces. That’s set in its configuration file.
sudo nano /etc/wazuh-dashboard/opensearch_dashboards.ymlFind the server.host line. If it’s set to 0.0.0.0, the dashboard is listening on all interfaces, including the public IP. That’s a no-no. Set it to the Tailscale IP of your server, the one you get with tailscale ip -4, from episode 1.
server.host: "<YOUR_TAILSCALE_IP>"Then restart the dashboard.
sudo systemctl restart wazuh-dashboardNext, the firewall, as a belt and braces. We’re following exactly the pattern from episode 1 for SSH, allowing port 443 only on the private network interface, never globally.
sudo ufw allow in on tailscale0 to any port 443 proto tcpThe pitfall to avoid is typing sudo ufw allow 443/tcp on its own. That command opens the dashboard to the whole world. Ours only opens it on tailscale0, your encrypted mesh. The difference is not cosmetic, one exposes your security console to internet scanners, the other makes it invisible.
The result is a dashboard accessible only by a member of your private network. A scan of your public IP reveals nothing. In line with the sovereign promise, and in line with common sense.
The grand tour
Log in. From a machine on your Tailnet, open https://<YOUR_TAILSCALE_IP> in your browser. Certificate warning, click through. Login admin, your new password. You’re in the console.
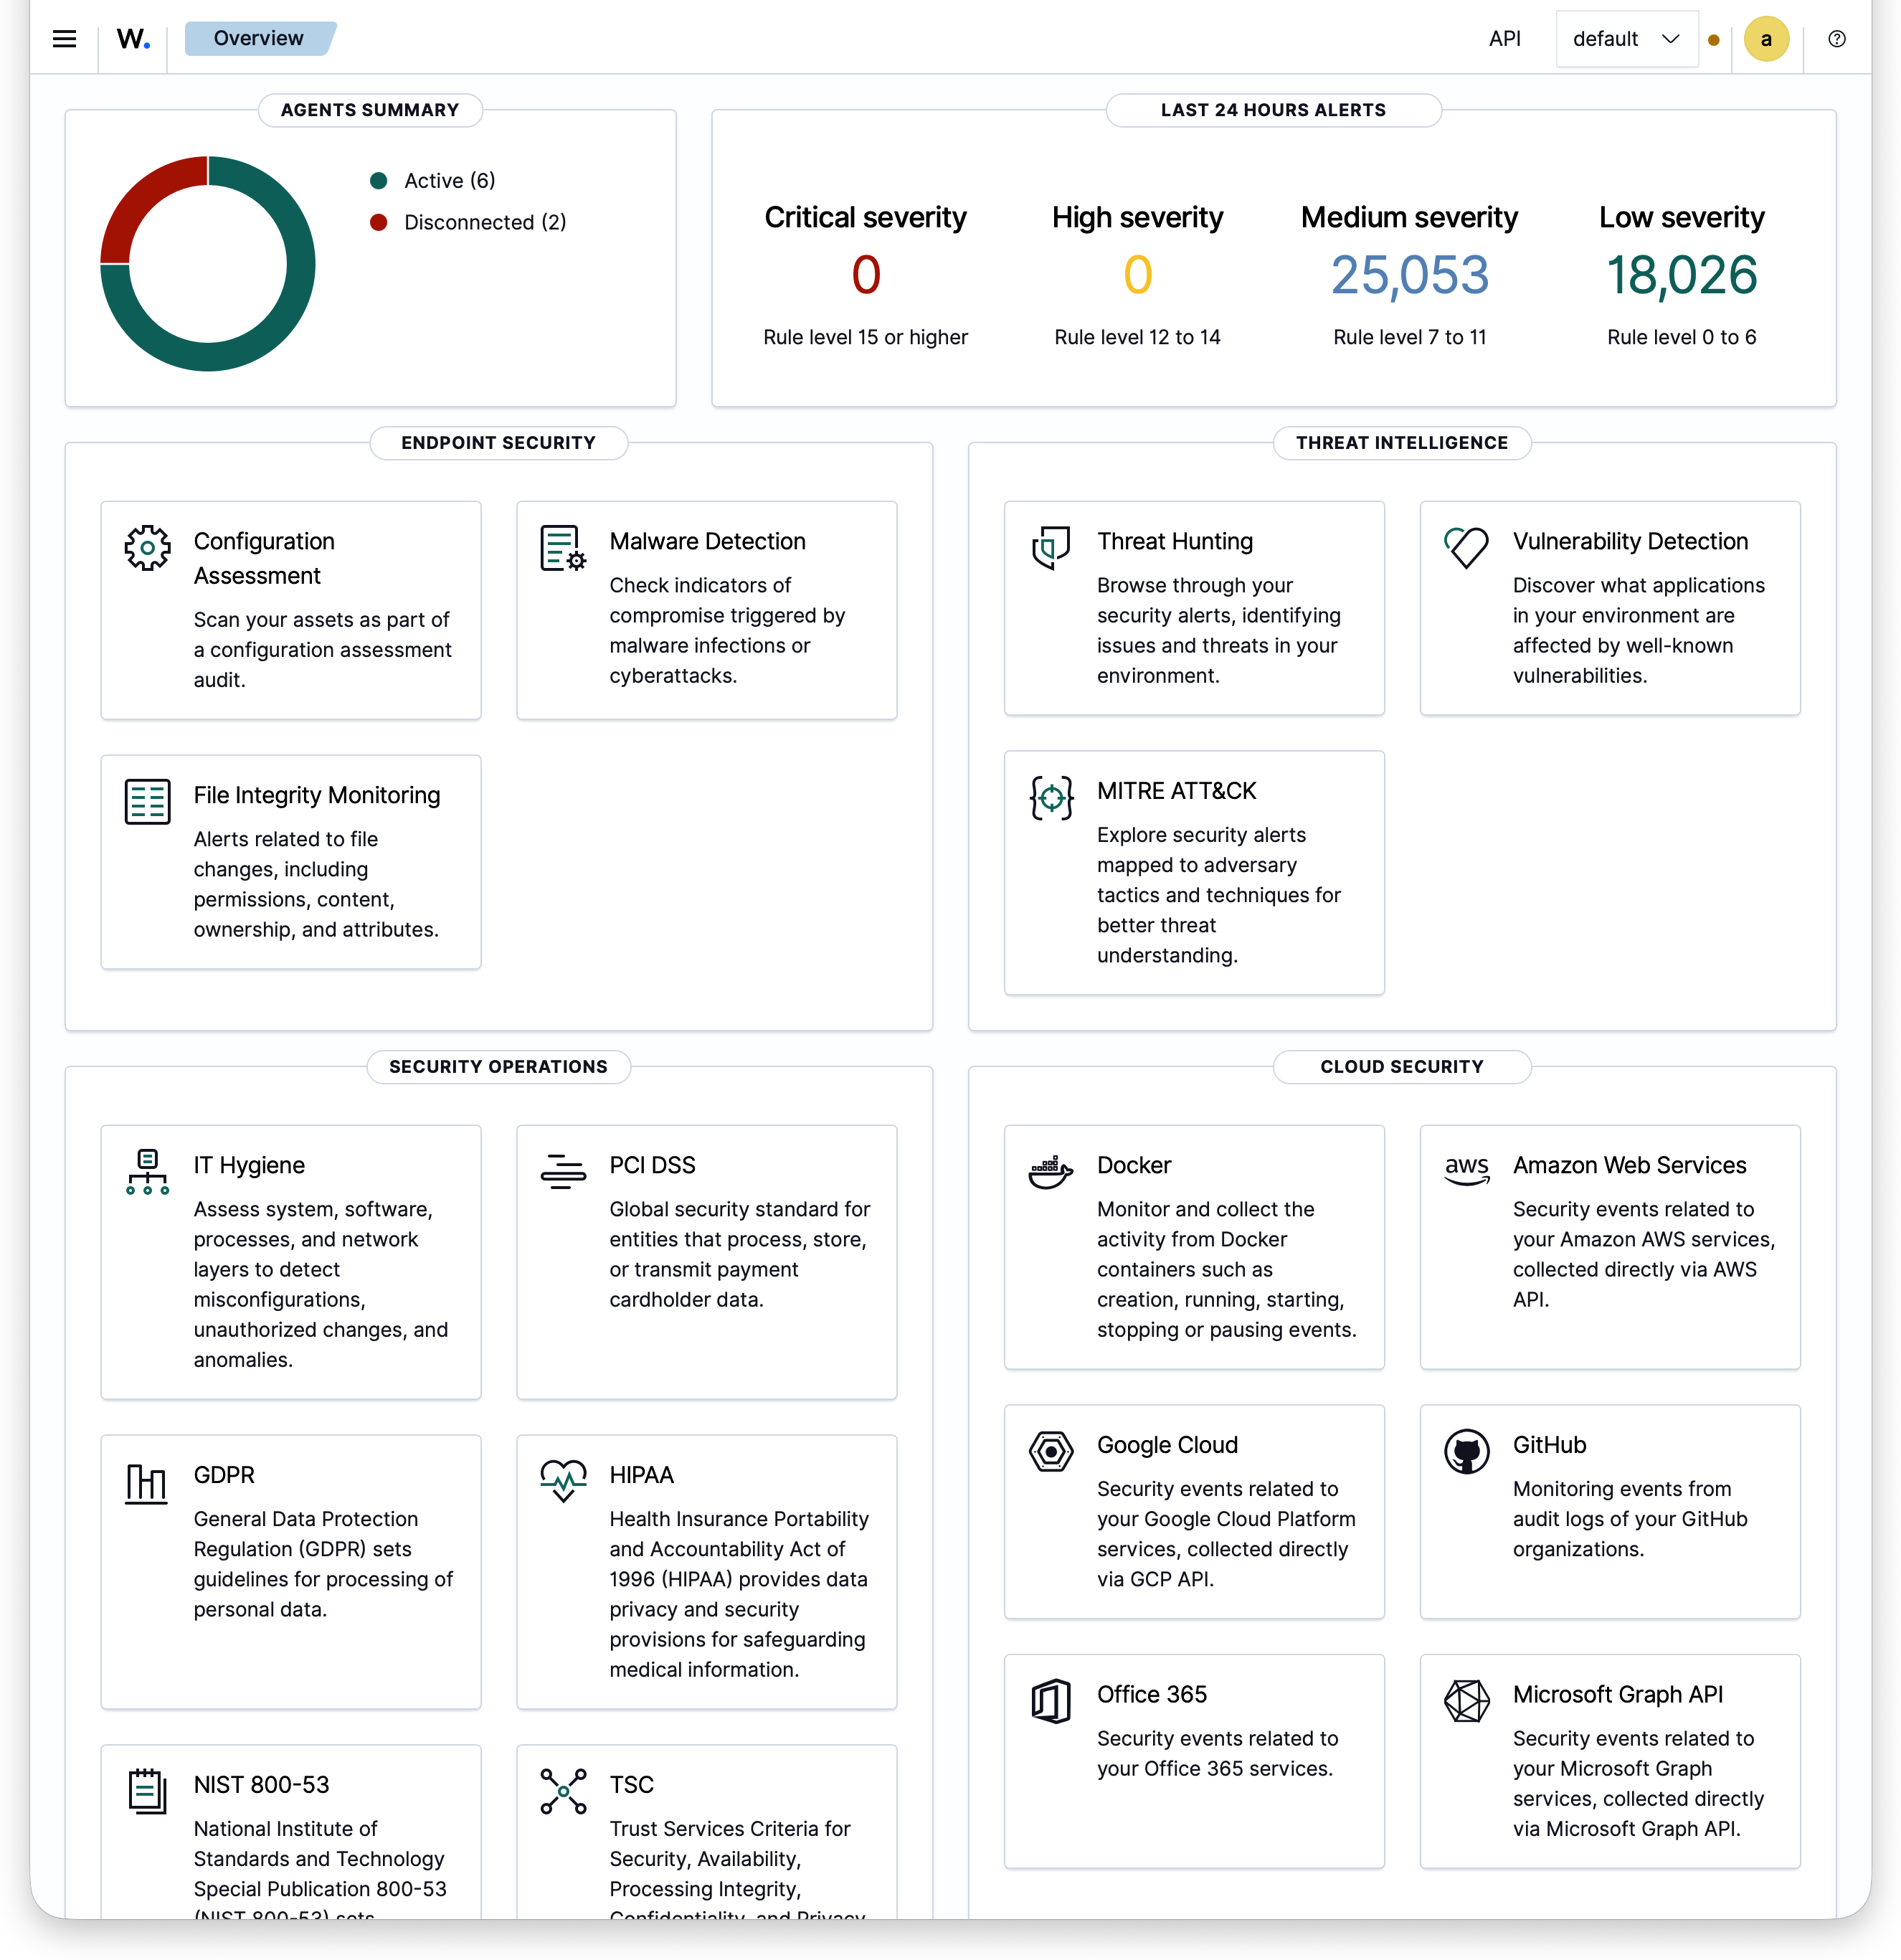
This screenshot is from a production Wazuh instance already populated with several agents. On your fresh install, you’ll only see agent 000, the server watching itself.
And there’s a pleasant surprise, it’s not empty. You were expecting maybe an inert screen while you deploy agents. Not at all. In all-in-one mode, the server comes with a local agent, with the ID 000, watching itself. Your machine is already under the eye of your own SIEM, before you’ve even touched the rest of your network.
In practical terms, you’ve already got data and several modules running on this node.
- SCA, for Security Configuration Assessment, is active by default, without any tuning, and it scans your machine against baseline security type CIS benchmarks. It tells you where your config deviates from best practices, a service too many, a permission too broad, a loose SSH setting. You’ll probably find, validated in black and white, the hardening decisions from episode 1.
- Vulnerability detection is on by default, but not active. Wazuh inventories the packages installed on the machine and crosses them with known CVE databases. If one of your packages has a published vulnerability, it flags it, with the reference and severity. A note of honesty, unlike SCA and FIM, which run on their own, the local node scan doesn’t trigger on startup. You have to enable it in the
/var/ossec/etc/internal_options.conffile, setvulnerability-detection.disable_scan_managerto0, then restart the manager. Two minutes later, your own machine is scanned too. - File Integrity Monitoring, or FIM, is watching your sensitive files and alerting you if any of them change. A sudden change in a system file is often the first sign that you’ve got an unwanted guest.
- Local log analysis, digesting the machine’s logs and turning them into readable alerts.
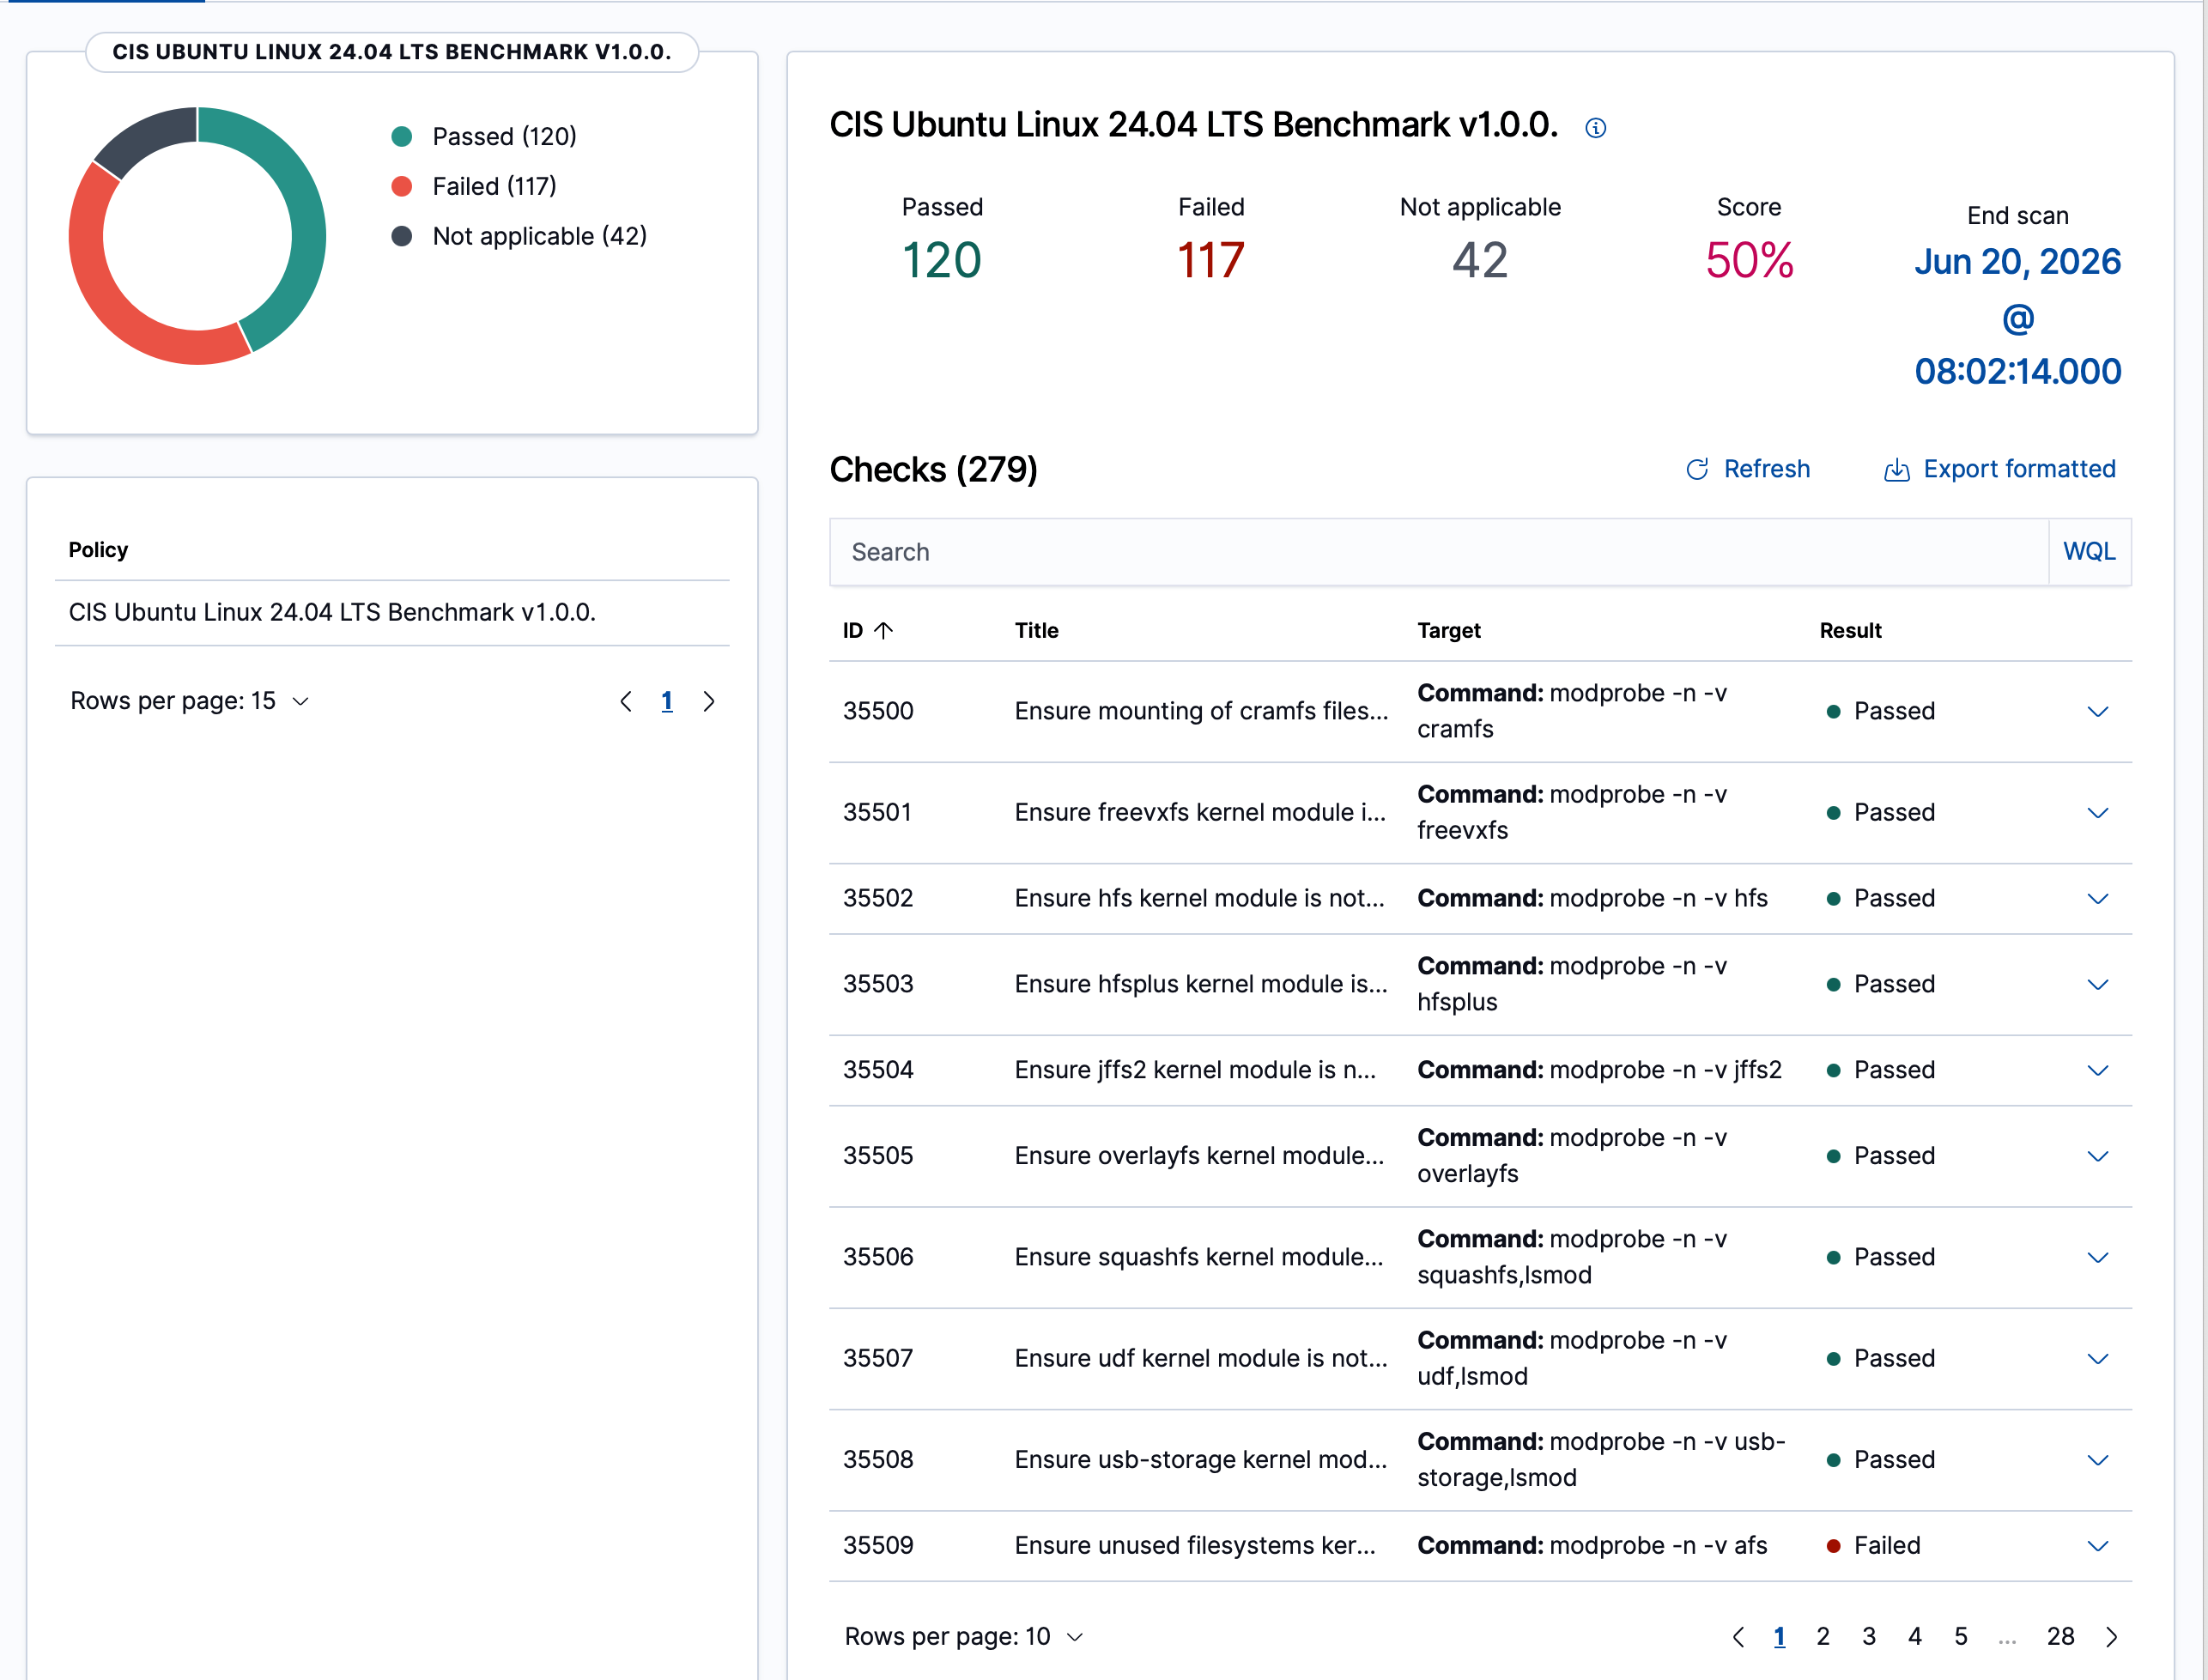
And there are the compliance dashboards, ready to go. Wazuh ships with views tagged PCI DSS, HIPAA, GDPR, NIST 800-53, TSC, with report generation. Each alert carries the compliance ID it touches, for example a gdpr_IV_32 tag that points to article 32 of the GDPR on security of processing.
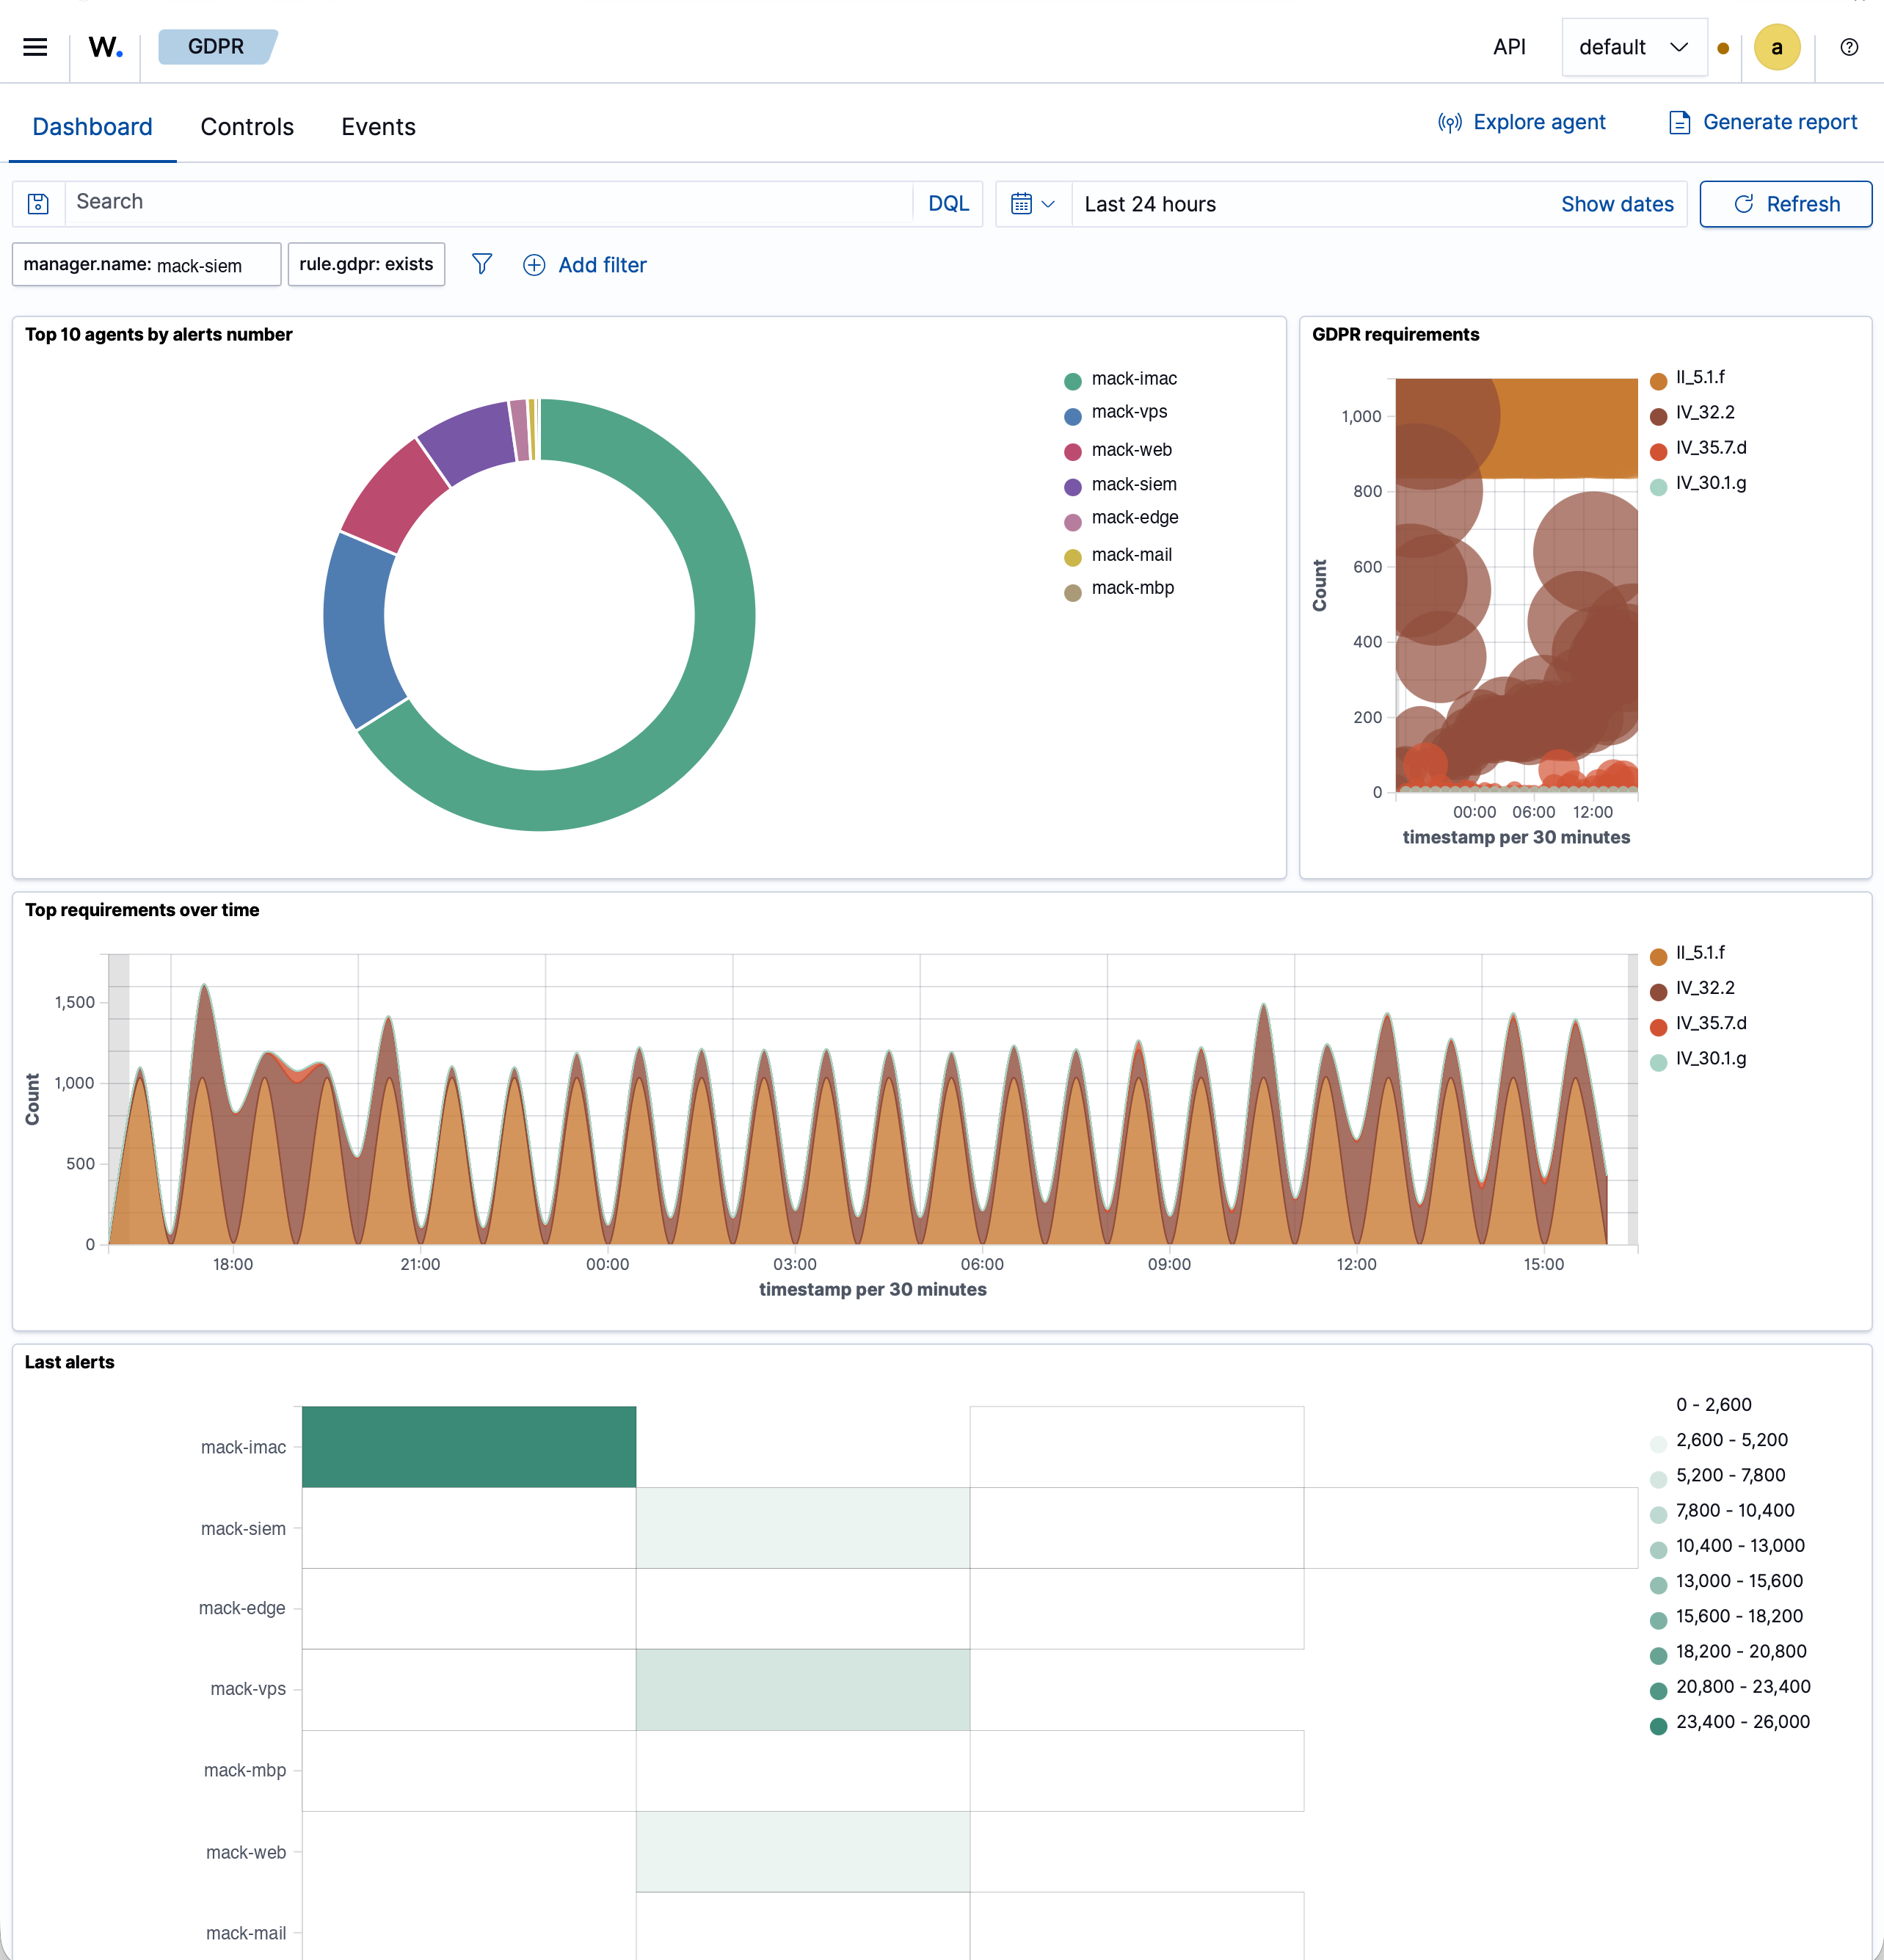
A necessary honesty note on NIS2. Wazuh provides all the functional bricks that NIS2 demands, continuous monitoring, file integrity, vulnerability analysis, configuration control, reporting. But it doesn’t have a NIS2 compliance dashboard ready to click like it does for GDPR.
To follow NIS2 finely, you’ll build your own views, leaning on the GDPR and NIST tags already present. Wazuh gives you the compliance toolkit, it doesn’t make you compliant all by itself. The calibration of rules, retention policy, incident response, that’s all human work. We called it out right from the opening, the hard part isn’t the tech, it’s the adjustment.
For now, your SIEM is seeing itself. It’s watching its own machine, and that’s already precious for validating your hardening. The real jump is when it starts seeing the rest of your network. That’s episode 3, deploying agents, the moment when your SIEM starts really seeing your network.
When all-in-one isn’t enough anymore
The single-node setup isn’t magic, and I’m not going to sell you the opposite. It has a ceiling, and it’s important to know where it is before you hit it.
The metric that matters is EPS, events per second that your machine can handle. A well-dimensioned node, around 16 GB of RAM and 8 vCPUs, can handle around 5,000 events per second. For a small business with up to 50 or 100 machines being watched, with normal log activity, you’re well below saturation. The all-in-one mode holds up just fine.
The day you approach saturation, the symptom is unpleasant. When the ingestion queue saturates, Wazuh doesn’t slow down politely, it drops events it can’t process fast enough. And an event dropped is an alert you’ll never see. A camera that stops recording during rush hour.
When that happens, you switch to multi-node, manager on one side, indexer on the other, or even several of each. Detail against intuition but important, Wazuh scales better horizontally than vertically. Two nodes with medium resources are better than one big node. That’s another project, outside this series, but you know now that the door exists.
For a small business just starting out, remember this, all-in-one is perfect for starting, not designed for infinity. And there’s plenty of room between the two.
What it would have cost you elsewhere
We’ve been teasing this figure since the series opened. Time to put it down, for this specific component.
Wazuh’s licensing cost is zero. It’s 100% open source, under GPLv2 license, and there’s no paid tier. No agent limit, no user limit, no log ingestion limit. Your only expense is the VPS you set up in episode 1, between 15 and 30 euros per month depending on the size, plus your installation and calibration time. And that’s it.
Splunk’s bill has a different face. A warning first, Splunk doesn’t publish its prices officially, so everything that follows is an order of magnitude estimate based on secondary serious sources, not the official quote. With that reservation, the principle is simple, you pay by the gigabytes of logs ingested per day, counted in gigabytes per day.
The challenge is to translate that into a real-world park size, because a price per gigabyte doesn’t mean anything until you know how many gigabytes a small business produces. Useful benchmark, with reasonable security logging, count around fifty megabytes of logs per workstation per day, so around one gigabyte per day for fifteen to twenty workstations. From there, we can put some numbers on it, licensing only, keeping Wazuh in the mirror.
- 15 workstations, around 1 GB of logs per day. Splunk, around 2,000 to 5,000 dollars per year. Wazuh, the VPS, 180 to 360 euros per year. That’s the point.
- 50 workstations, around 4 to 5 GB per day. Splunk, around 8,000 to 12,500 dollars per year. Wazuh, the same VPS, to the euro.
- 100 workstations, around 8 to 10 GB per day. Splunk, around 15,000 to 25,000 dollars per year. Wazuh, still the same VPS.
Beyond a hundred workstations surveilled, we’re in another world on both sides, multi-node clusters on Wazuh, paliers in the tens or hundreds of thousands of dollars per year on Splunk. That’s another scale, outside the perimeter of this series thought for the small business.
The difference isn’t just about money. It’s about trajectory. With Wazuh, your infrastructure cost is flat, you ingest more logs, your VPS handles it, your bill doesn’t change. With Splunk, the meter spins with every additional gigabyte. The more your SIEM sees wide and deep, the more it costs you dear, whereas seeing wide and deep is literally its job.
And there’s the question that started this series, who controls the data. Your logs, they’re the complete fingerprints of your network. With Wazuh, they’re on your machine, in Switzerland, under your control.
With the SaaS American vendor, they’re subject to the CLOUD Act. The price, that’s one thing. Who holds the data, that’s the thing that matters the most.
In summary
You started with an empty safe, and you’re leaving with a security console running.
You installed Wazuh’s three components in one command, manager, indexer, and dashboard on your single node. You set the memory trap that breaks most installs, the indexer’s heap to half of RAM, with identical lower and upper bounds, which justifies the 12 GB recommended in episode 1.
You took back control of security, regenerated passwords, certificates already in place, and especially the dashboard locked down to the Tailnet, invisible from the internet. And you took your first tour of the owner’s deck, SCA, vulnerabilities, file integrity monitoring, local log analysis, compliance dashboards ready to go, all on your own machine, without deploying any remote agents yet.
All for zero euros in licensing, where the same perimeter with an American vendor would run from a few thousand to tens of thousands of dollars per year, depending on the size of your fleet, with your logs stored in a very unfavorable jurisdiction.
But your SIEM only sees itself so far. It’s watching its own machine, and that’s already precious for validating your hardening. The real jump is when it starts seeing the rest of your network. That’s episode 3, deploying agents, the moment when your SIEM starts really seeing your network.
Unknown technical terms? Check the glossary.